

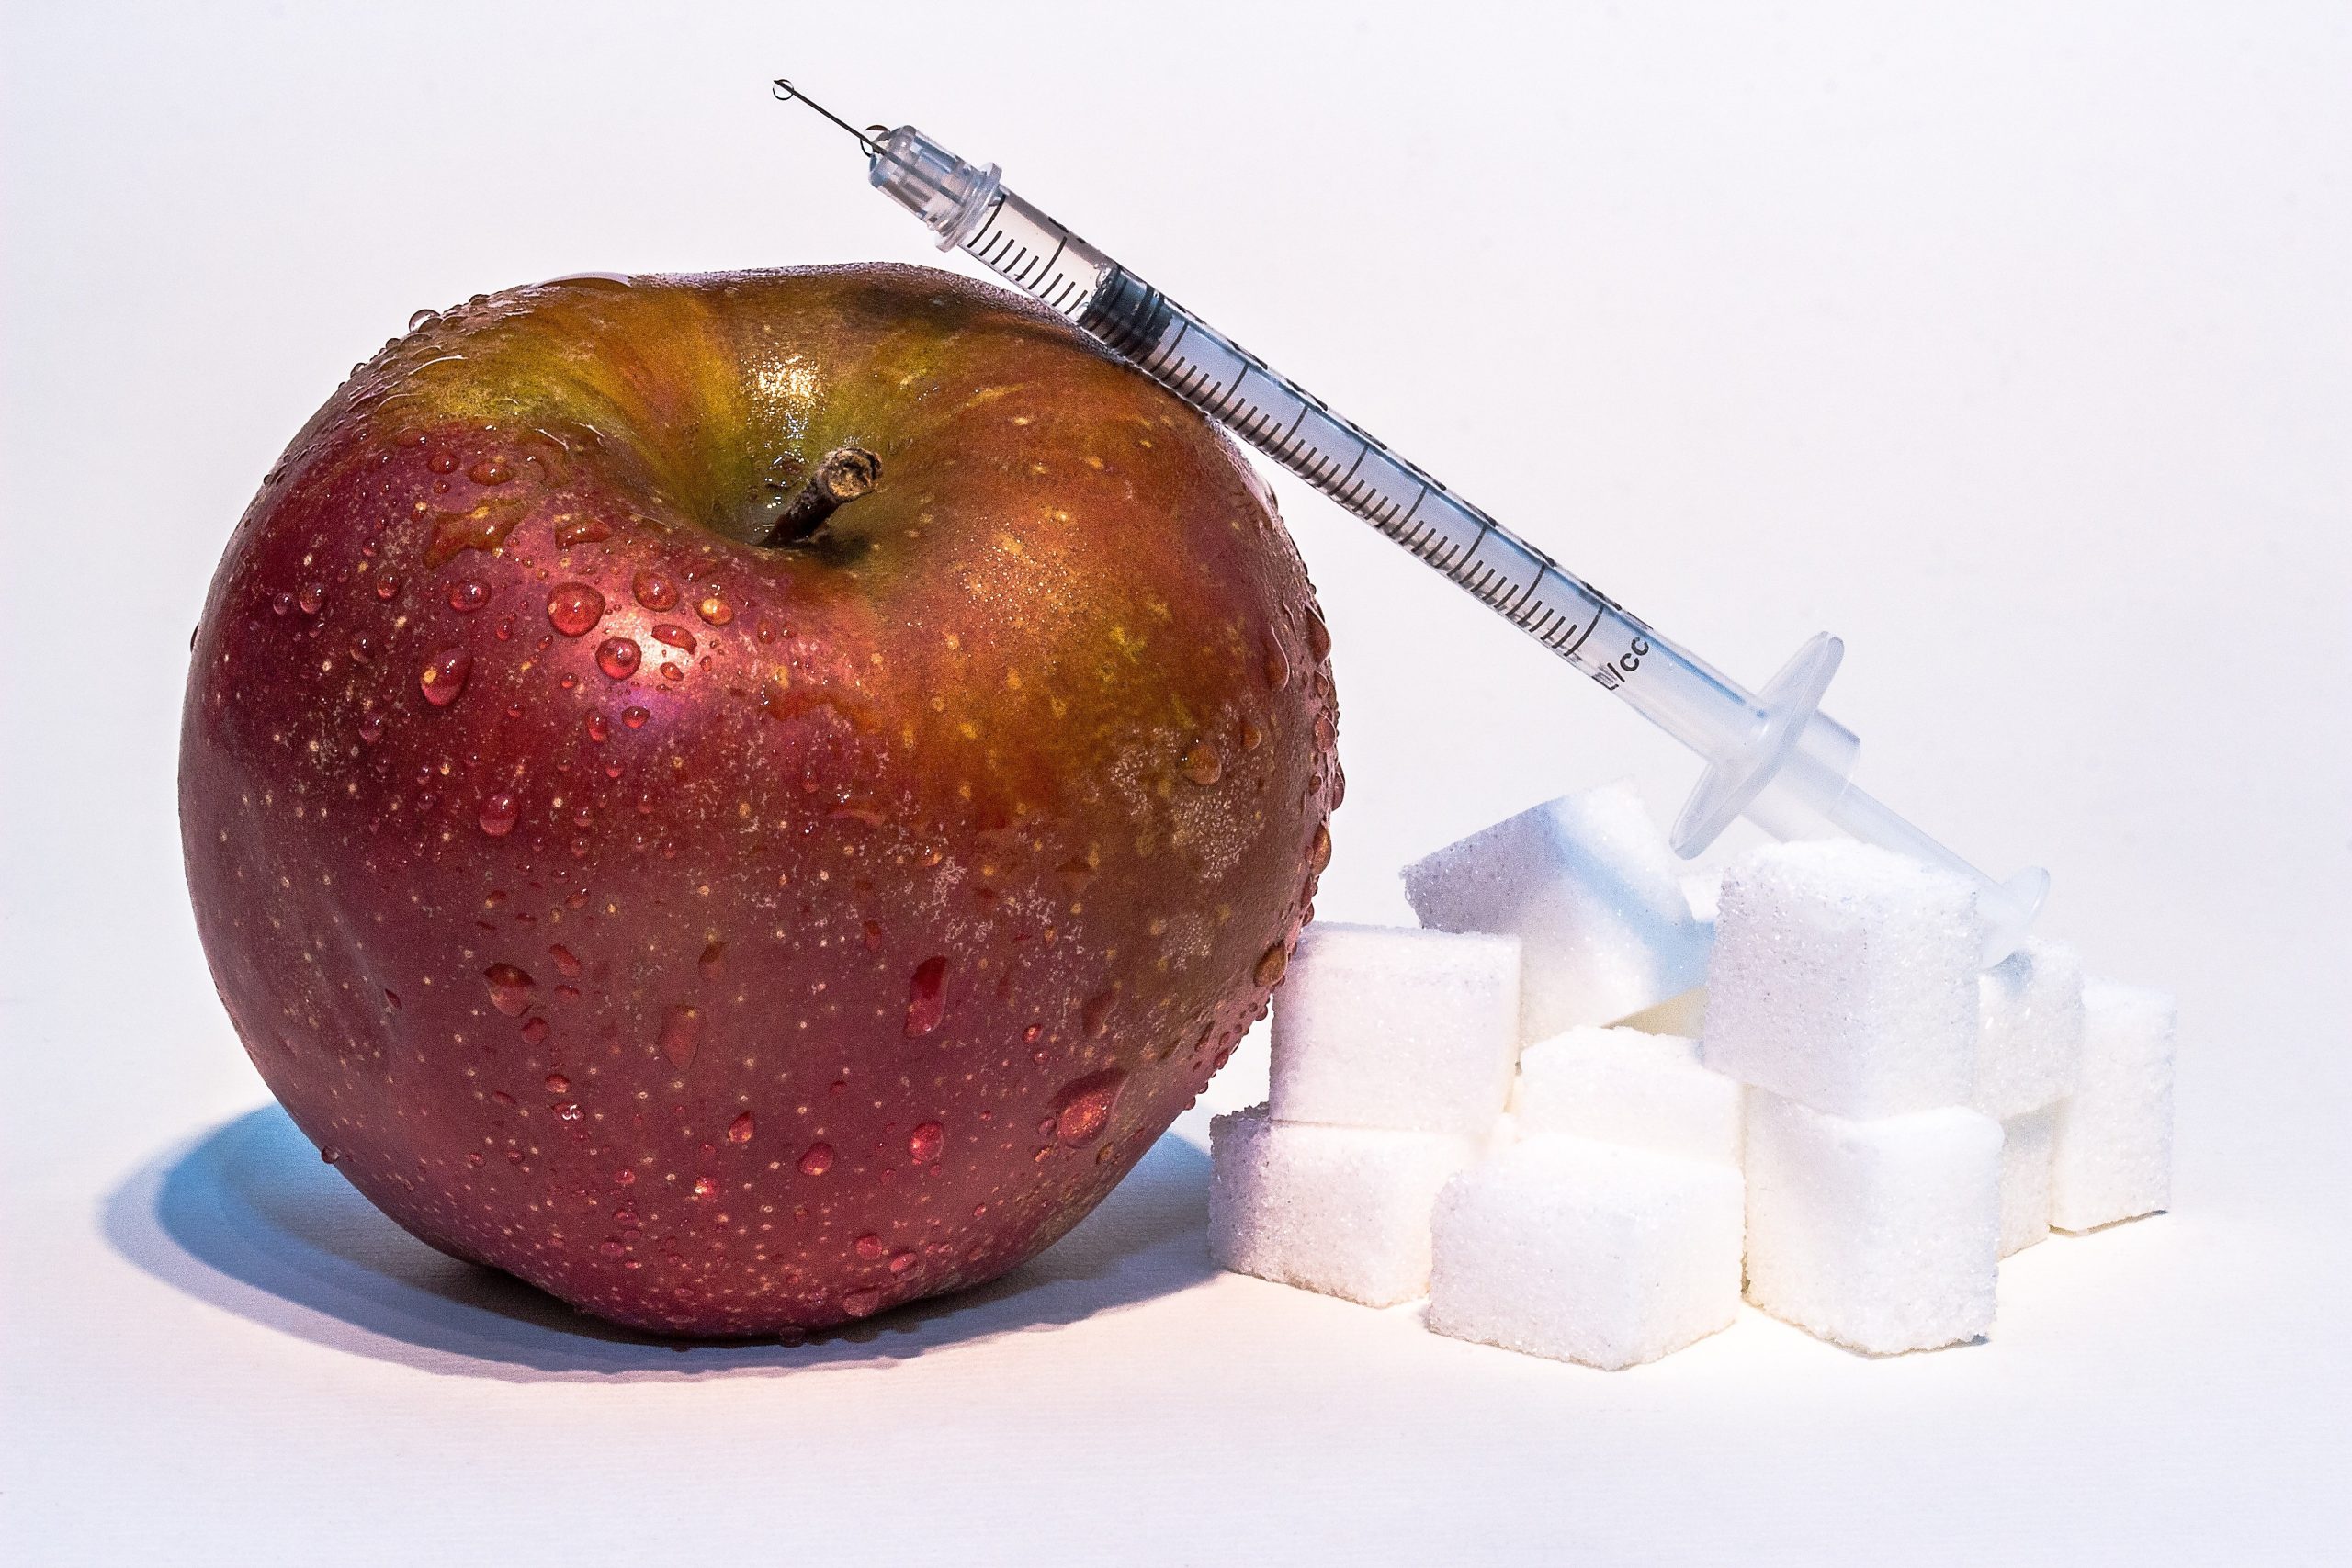
Insulin resistance is estimated to affect around 40% of US adults — and the majority have no idea. Not because the condition is subtle, but because the standard blood test most doctors order (fasting glucose) can remain perfectly normal for years while insulin resistance is actively progressing. By the time blood sugar rises, the underlying dysfunction has usually been present for a decade or more.
The signs are there long before a diagnosis. The pattern of symptoms — how you feel after a carbohydrate-heavy meal, where your body stores fat, the quality of your energy throughout the day — often points directly to insulin resistance before any blood test confirms it. And the specific tests that would detect it early are not complicated: they just need to be asked for.
This guide covers the recognisable signs, the blood tests to request and how to interpret them (including the fasting insulin test that most primary care panels leave out), what the results actually mean, and the concrete steps most effective for reversing the condition.
What Insulin Resistance Actually Is
Insulin is the hormone that acts as a key, unlocking cells to allow glucose entry. After you eat, blood glucose rises; the pancreas releases insulin; insulin signals cells — muscle, liver, fat — to absorb glucose for energy or storage. The system works efficiently when cells respond readily to the signal.
In insulin resistance, the lock becomes stiff. Cells require progressively more insulin to achieve the same glucose uptake. The pancreas responds by producing more — often much more — insulin to compensate. This compensation can maintain normal blood glucose for years. During this entire phase, a standard fasting glucose test looks fine. Blood sugar is controlled. The problem is invisible to standard testing.
Eventually, the pancreas cannot sustain the compensatory overproduction. Blood sugar starts to rise. Prediabetes is diagnosed. Then type 2 diabetes. But the damage — to blood vessel walls, hormonal signalling, brain function, and metabolic rate — was accumulating throughout the silent phase, driven by the chronically elevated insulin itself, not by elevated glucose.
This is why understanding the signs of insulin resistance and testing fasting insulin — not just fasting glucose — matters so much. Detecting it early is the difference between preventing a cascade and managing its consequences.
Insulin Resistance Symptoms
Energy and Hunger Patterns
The most consistent early symptoms of insulin resistance are not dramatic — they are patterns of energy and appetite that most people attribute to poor sleep, stress, or just “getting older.” Understanding the mechanism behind each makes them more recognisable.

- Post-meal energy crash (30–90 minutes after eating): when cells resist insulin, glucose enters poorly despite a normal or elevated blood sugar response. Blood glucose spikes, then drops sharply as the overcompensating pancreas floods insulin. The sharp glucose decline triggers cortisol and adrenaline release — producing the recognisable mid-afternoon slump, brain fog, or irritability that appears specifically after meals, especially carbohydrate-heavy ones.
- Intense sugar and carbohydrate cravings: the brain interprets poor cellular glucose uptake as a state of starvation — even when blood glucose is adequate. The result is driven hunger specifically for fast-energy foods: bread, pasta, sweets. The craving cycle self-perpetuates because each carbohydrate hit triggers another insulin spike and another crash.
- Difficulty feeling full after meals: chronically elevated insulin impairs leptin signalling. Leptin is the adipose-derived hormone that signals satiety — elevated insulin blocks leptin receptors in the hypothalamus, meaning the fullness signal is attenuated even after adequate food intake. Leptin resistance commonly co-exists with insulin resistance.
- Persistent fatigue despite adequate sleep: mitochondrial glucose uptake is impaired in insulin-resistant states. Even when blood glucose is normal, the efficiency of cellular energy production from that glucose is reduced. The result is a low-energy baseline that sleep does not resolve — distinct from the general tiredness of a poor night.
- Afternoon energy slump: the cortisol-insulin interaction creates predictable energy troughs in the early-to-mid afternoon, often accompanied by difficulty concentrating, word retrieval problems, and a strong drive to eat or caffeinate.
Body Composition and Weight Distribution
How and where the body stores fat is one of the most visible physical indicators of insulin resistance — and the direction of causation runs both ways.
- Abdominal and visceral fat accumulation: elevated insulin shifts fatty acid metabolism toward fat storage rather than fat oxidation. Visceral adipose tissue — the fat surrounding the abdominal organs — is particularly insulin-sensitive and grows preferentially in insulin-resistant states. A waist circumference above 35 inches in women and 40 inches in men is an accepted clinical threshold for elevated metabolic risk. Visceral fat itself then worsens insulin resistance by releasing inflammatory cytokines and free fatty acids, creating a reinforcing cycle.
- Difficulty losing weight despite dietary restriction: when insulin is chronically elevated, lipolysis (the release of fatty acids from fat cells for burning) is suppressed. Even with a caloric deficit, if dietary patterns maintain high insulin — particularly through frequent meals and refined carbohydrate intake — fat mobilisation is persistently blocked.
- Weight gain concentrated in the midsection: fat depositing preferentially at the abdomen, rather than distributed across the body, is a characteristic pattern of hyperinsulinaemia.
Cognitive and Mood Symptoms
The brain is highly insulin-sensitive — insulin receptors are concentrated in the hippocampus, prefrontal cortex, and hypothalamus. Impaired insulin signalling in the brain produces cognitive symptoms that are often the earliest subjective indicators of metabolic dysfunction.
- Brain fog and difficulty concentrating: impaired neuronal glucose uptake reduces the metabolic fuel available for cognitive processing. Many people notice this specifically after carbohydrate-heavy meals — a post-lunch cognitive slowdown that is disproportionate to what most people consider normal tiredness.
- Anxiety and irritability between meals: reactive blood glucose fluctuations — the glucose drop following an insulin overresponse — activate the sympathetic nervous system. The physical symptoms (racing heart, tension, irritability) often precede awareness of hunger and are frequently misattributed to anxiety disorders.
- Memory and word-retrieval difficulties: emerging research connects chronic insulin resistance to reduced BDNF (brain-derived neurotrophic factor) and increased neuroinflammation in the hippocampus. These changes are associated with accelerated cognitive decline and are one of the proposed mechanisms linking insulin resistance to Alzheimer’s risk.
Hormonal Symptoms — Particularly in Women
This section addresses the most-searched variant in the entire cluster: insulin resistance symptoms in females. The female presentation is substantively different from the generic description — not just a matter of severity but of mechanism.
Elevated insulin directly stimulates the ovaries to produce androgens (testosterone, DHEA). This androgen excess is the driver of the most characteristic female insulin resistance symptoms and is the central mechanism in PCOS (polycystic ovary syndrome), which affects an estimated 1 in 10 women of reproductive age. Understanding the insulin-androgen connection is essential for women experiencing these symptoms.
- Irregular or absent menstrual cycles: excess androgen production from insulin-stimulated ovaries disrupts the luteinising hormone (LH) surge that triggers ovulation. Anovulatory cycles, irregular periods, or amenorrhoea are common results.
- Hormonal acne (jaw, chin, lower face): androgen excess stimulates sebaceous gland activity and drives the pattern of deep, cystic acne concentrated along the jaw and chin — distinct from the blackhead-dominated forehead acne of adolescence.
- Hirsutism (excess facial or body hair): testosterone and DHEA excess drives hair growth in androgen-sensitive areas — upper lip, chin, chest, lower abdomen.
- Hair thinning or androgenic alopecia: elevated DHT (converted from testosterone) at hair follicles accelerates miniaturisation on the scalp in genetically susceptible women.
- Difficulty conceiving: anovulation secondary to insulin-driven androgen excess is one of the most common causes of female subfertility.
Managing the hormonal dimension of insulin resistance in women is not just about blood sugar — it requires addressing the insulin-androgen axis directly. The guide to hormone balance supplements covers how inositol, zinc, magnesium, and other nutrients support hormonal regulation in the context of insulin resistance.
In post-menopausal women, oestrogen decline dramatically increases insulin resistance — explaining why many women experience sudden central weight gain, worsening blood sugar control, and metabolic shift in their 50s. This is not simply ageing; it is a predictable physiological consequence of the oestrogen-insulin interaction that becomes less protective at menopause.
Physical Signs You Can See: Skin and Body
Acanthosis Nigricans — The Skin Signal That Confirms Hyperinsulinaemia
“Insulin resistance neck” is searched 2,700 times per month by people who have noticed something unusual about their skin and suspect metabolic dysfunction. The clinical term is acanthosis nigricans, and understanding what it is — and what it is not — removes a significant source of confusion.
Acanthosis nigricans appears as dark, velvety, slightly thickened patches of skin at skin fold areas. The most common sites are the back and sides of the neck, the armpits, the groin, the elbows, and the knuckles. The texture is distinctly different from surrounding skin — slightly raised, rough, and velvety rather than smooth.
Why it happens: excess circulating insulin activates insulin-like growth factor 1 (IGF-1) receptors in keratinocytes — the skin cells of the epidermis. This stimulates abnormal proliferation and increased melanin deposition, producing the characteristic darkening and thickening. The darkening is structural, not pigmentary in the conventional sense — it cannot be scrubbed away, is not caused by dirt, and does not respond to skin-lightening products. The only effective treatment is reducing insulin levels.
Skin tags (acrochordons) at the same locations are driven by the same IGF-1 receptor overstimulation mechanism. Their presence — particularly multiple skin tags in the neck and axillary regions — is an independent physical sign of hyperinsulinaemia.
Other Physical Indicators
- Buffalo hump: fat accumulation at the posterior neck, driven by the cortisol-insulin interaction. Associated with both insulin resistance and hypercortisolaemia.
- Central fat distribution pattern: fat depositing preferentially in the abdomen, flanks, and face while extremities remain lean is characteristic of insulin-driven fat storage.
- Fluid retention: insulin promotes sodium reabsorption in the renal tubule, causing water retention. Puffiness in the fingers, ankles, and face — particularly pronounced after high-carbohydrate meals — can reflect this.
How to Test for Insulin Resistance

Why Your Standard Blood Tests May Miss It
The most important thing to understand about insulin resistance testing is that the standard primary care blood panel — fasting glucose and HbA1c — is designed to detect diabetes, not insulin resistance. These tests show the consequence of failed compensation, not the compensation itself.
Here is what can happen: a person with significant insulin resistance has a fasting glucose of 94 mg/dL (well within the normal range of 70–99), and an HbA1c of 5.4% (well below the prediabetes threshold of 5.7%). Their doctor reviews the panel and says everything looks fine. What the panel did not measure: the fasting insulin level is 24 µIU/mL. HOMA-IR calculation: 5.6 — severe insulin resistance.
This is not a rare edge case. It is the typical presentation of insulin resistance in its middle years — when the pancreas is still compensating adequately to keep glucose normal, while producing damaging levels of insulin in the process. Early detection requires measuring insulin, not just glucose.
The Fasting Insulin Test — What to Ask For and How to Interpret It
The test: a fasting serum insulin level, ordered as “insulin, fasting” on a standard lab requisition. Requires 8–12 hours of fasting (water only) before the blood draw. Can be added to any existing blood panel order.
Reference range confusion: most standard lab reference ranges for fasting insulin list “normal” as 2–25 µIU/mL or sometimes higher. This range is wide enough to include significant insulin resistance — it was calibrated against the general population, which now includes a large proportion of insulin-resistant individuals.
More meaningful interpretation ranges from functional and integrative medicine practice:
- Below 8–10 µIU/mL: optimal insulin sensitivity. Ideal target for metabolic health.
- 10–15 µIU/mL: early warning range. Lifestyle modification is warranted.
- Above 15 µIU/mL with normal blood glucose: strong indicator of significant insulin resistance. Even if your doctor says “normal,” this warrants attention.
- Above 25 µIU/mL: severe hyperinsulinaemia regardless of glucose level.
HOMA-IR: Calculating Your Insulin Resistance Score
HOMA-IR (Homeostatic Model Assessment of Insulin Resistance) combines fasting insulin and fasting glucose into a single score that is the standard clinical research calculation for estimating insulin resistance. If you have both values from a blood test, you can calculate it.
Formula: (Fasting insulin in µIU/mL × Fasting glucose in mmol/L) ÷ 22.5
Converting glucose from mg/dL to mmol/L: divide by 18. So 95 mg/dL = 5.28 mmol/L.
Worked example: fasting insulin 15 µIU/mL, fasting glucose 95 mg/dL (5.28 mmol/L).
HOMA-IR = (15 × 5.28) ÷ 22.5 = 79.2 ÷ 22.5 = 3.5 → insulin resistant.
| HOMA-IR Score | Interpretation | Clinical meaning |
|---|---|---|
| Below 1.0 | Optimal | Excellent insulin sensitivity |
| 1.0 – 2.0 | Normal | Healthy range for most adults |
| 2.5 – 4.9 | Insulin resistant | Significant insulin resistance present |
| 5.0 and above | Severe insulin resistance | High risk for prediabetes / metabolic syndrome |
The Triglyceride:HDL Ratio — Using Existing Blood Work
If you have a standard lipid panel from a recent blood test, you already have data that can indicate insulin resistance. The triglyceride:HDL ratio (using mg/dL values for both) is a widely used proxy, often detectable years before fasting glucose rises.
Calculate it: divide your triglycerides by your HDL. A ratio above 2.0 is associated with insulin resistance in multiple population studies. A ratio above 3.0 is a strong indicator. A ratio of 5.0 or above suggests severe metabolic dysfunction.
Example: triglycerides 150 mg/dL ÷ HDL 45 mg/dL = ratio 3.3 → likely insulin resistant.
Why it works: insulin resistance drives triglyceride elevation (by reducing LPL enzyme activity and increasing VLDL production) and HDL reduction (through CETP-mediated depletion). These two move inversely in insulin-resistant states, making the ratio a sensitive early signal even in people with normal blood glucose.
The Oral Glucose Tolerance Test (OGTT) With Insulin
The most sensitive clinical test for early insulin resistance is a 2-hour OGTT with insulin measurements at 0, 1, and 2 hours. It shows whether insulin spikes excessively — a fivefold or greater increase from baseline — in response to a glucose challenge, even if glucose itself returns to normal by 2 hours. This is the earliest detectable metabolic signal.
Not commonly ordered in routine care. Can be specifically requested, and is standard in PCOS evaluation. For people strongly suspicious of insulin resistance despite normal standard tests, this is the definitive next step.
Insulin Resistance vs. Prediabetes vs. Type 2 Diabetes

These three terms describe points on a continuum, not distinct diseases. Understanding the distinctions addresses the anxiety many people feel about what a possible insulin resistance diagnosis means.
| Stage | Fasting glucose | Key marker | Reversibility |
|---|---|---|---|
| Insulin resistance | Typically normal (70–99) | Elevated fasting insulin; high HOMA-IR | Highly reversible |
| Prediabetes | 100–125 mg/dL | HbA1c 5.7–6.4% | Often fully reversible |
| Type 2 diabetes | 126 mg/dL or above | HbA1c 6.5% or above | Manageable; partial reversal possible |
The progression from insulin resistance to prediabetes to type 2 diabetes is not inevitable — it is a consequence of the underlying dysfunction going unaddressed. Each stage, including early type 2 diabetes, responds substantially to lifestyle intervention. Insulin resistance detected before fasting glucose rises has the best reversal trajectory of any point on this continuum.
What to Do If You Have Insulin Resistance
Diet — The Highest-Impact Variable
Reducing refined carbohydrates and added sugars is the most effective single dietary change for insulin resistance. The mechanism is direct: fewer high-glycaemic carbohydrates means lower post-meal insulin demand, lower average insulin levels throughout the day, reduced triglyceride production, and improved leptin signalling.
What this looks like in practice: eliminating sugar-sweetened beverages, reducing white bread, white rice, processed cereals, and pastries. Replacing these with whole foods — vegetables, legumes, protein, healthy fats — that produce lower insulin responses. The glycaemic index of carbohydrate sources matters, not just total carbohydrate quantity. Choosing lower-glycaemic options like basmati rice, sweet potato, or legumes over white rice or refined bread makes a meaningful difference. The guide on brown rice and blood sugar management covers the glycaemic distinctions in practical detail.
Time-restricted eating (compressing meals into an 8–10 hour window) reduces total daily insulin exposure without necessarily changing what is eaten — giving the pancreas and insulin receptors extended rest periods that support recovery of sensitivity. Some evidence also suggests apple cider vinegar taken before or with meals modestly blunts post-meal glucose and insulin responses through acetic acid’s effect on amylase activity and gastric emptying.
Exercise — The Most Efficient Insulin Sensitiser
Muscle contraction activates GLUT4 transporters — glucose transporters that move to the cell membrane independently of insulin during exercise. This means that during and for hours after exercise, working muscles can take up glucose without requiring the insulin signal. Exercise literally bypasses insulin resistance for glucose uptake.
Both aerobic exercise (walking, cycling, swimming) and resistance training (weight training) improve insulin sensitivity through complementary mechanisms. Aerobic exercise increases mitochondrial density and GLUT4 expression; resistance training increases the mass of insulin-sensitive muscle tissue. Combining both produces greater improvement than either alone.
A 10-minute walk after meals measurably blunts the post-meal glucose and insulin spike — one of the simplest, most evidence-backed interventions for insulin resistance available, requiring no equipment or significant time commitment.
Supplements With Clinical Evidence
These are adjunctive tools — they support the dietary and exercise changes that form the foundation, rather than substituting for them.
- Inositol: Inositol — specifically the combination of myo-inositol and D-chiro-inositol in a 40:1 ratio — improves insulin receptor signalling by supporting the second messenger pathway through which insulin acts inside the cell. This is the most evidence-backed supplement specifically for PCOS-related insulin resistance, with multiple RCTs showing improved insulin sensitivity, reduced androgens, and restored ovulation.
- Chromium: Chromium (200–400 µg as chromium picolinate) is an essential trace mineral that serves as a cofactor for the insulin receptor complex. Multiple RCTs have shown chromium picolinate reduces fasting insulin, improves glucose tolerance, and enhances insulin receptor sensitivity in people with metabolic syndrome and prediabetes.
- Alpha lipoic acid: Alpha lipoic acid (300–600 mg/day) is both a mitochondrial antioxidant and an insulin sensitiser that stimulates GLUT4 translocation and improves peripheral glucose uptake through AMPK activation. It also reduces the oxidative stress associated with insulin resistance.
- Berberine: 1,500 mg/day in three divided doses activates AMPK (the cellular energy sensor), producing effects that parallel metformin in multiple head-to-head trials. Reduces fasting glucose, fasting insulin, and triglycerides in people with prediabetes and metabolic syndrome. One of the most clinically supported non-prescription metabolic supplements available.
Signs Your Insulin Resistance Is Improving
Tracking improvement matters for motivation and for knowing whether the intervention is working. These signs typically appear in order:
- More stable energy throughout the day: the post-meal crash becomes less pronounced or disappears. Energy is maintained for 4–5 hours after eating without the acute dip that previously required snacking or caffeine.
- Reduced carbohydrate cravings: as insulin levels normalise and leptin resistance improves, the intense drive toward sugary or starchy foods diminishes. Meals become more satisfying at appropriate portions.
- Gradual reduction in waist circumference: visceral fat is among the first fat stores to mobilise as insulin levels fall and lipolysis is restored. Visible abdominal reduction often precedes measurable weight change on a scale.
- Improved sleep quality and morning alertness: insulin resistance disrupts sleep architecture through nocturnal glucose fluctuations and cortisol dysregulation. As metabolic stability improves, sleep deepens.
- Reduced fasting insulin on retest: the most objective confirmation. A retest of fasting serum insulin after 8–12 weeks of consistent lifestyle change should show a measurable decline. A reduction of fasting insulin by 30–50% over 3–6 months of intensive lifestyle change is achievable and well-documented in intervention studies.
Frequently Asked Questions
Can you have insulin resistance with normal blood sugar?
Yes — this is the single most important thing to understand about insulin resistance. The pancreas compensates for cellular insulin resistance by producing more insulin, which maintains normal blood glucose for years. During this phase, standard blood tests (fasting glucose, HbA1c) look normal while insulin is chronically elevated and metabolic damage is accumulating. A fasting insulin test or HOMA-IR calculation is needed to detect insulin resistance in this stage — and this is precisely why many people feel metabolically unwell while being told their labs are fine.
What is a normal fasting insulin level?
Standard lab reference ranges typically list 2–25 µIU/mL as “normal” — a range wide enough to include significant insulin resistance. A more meaningful target: below 8–10 µIU/mL represents optimal insulin sensitivity. Fasting insulin consistently above 15 µIU/mL alongside normal blood glucose is a strong indicator of significant insulin resistance, even if it falls within the lab reference range. Discuss the functional range with your doctor or a functional medicine practitioner.
Does insulin resistance cause fatigue?
Yes. When cells resist insulin, glucose entry into cells — including brain cells and muscle cells — is impaired. Cellular energy production becomes inefficient even with adequate blood glucose. The result is a persistent low-energy baseline that sleep does not resolve, combined with pronounced energy crashes 30–90 minutes after carbohydrate-heavy meals. This pattern — fatigue that is meal-dependent rather than purely sleep-dependent — is one of the most characteristic functional signs of insulin resistance.
Is insulin resistance reversible?
Yes — particularly in the earlier stages. Insulin resistance detected before fasting glucose is significantly elevated is highly responsive to lifestyle intervention. Multiple studies show full reversal of insulin resistance and return of normal fasting insulin levels within 3–6 months of consistent dietary change, regular exercise, and sleep optimisation. Even prediabetes-stage insulin resistance is frequently fully reversible. The Diabetes Prevention Program study showed that intensive lifestyle intervention reduced progression from prediabetes to type 2 diabetes by 58% over 3 years — more effective than metformin.
